 |

The spread between the 5-year Treasury note and the federal funds rate averaged 44 basis points in the 1980s. This was a period of high interest rates and (relatively) high inflation. The spread in the 1990s averaged a much higher 116 basis points.
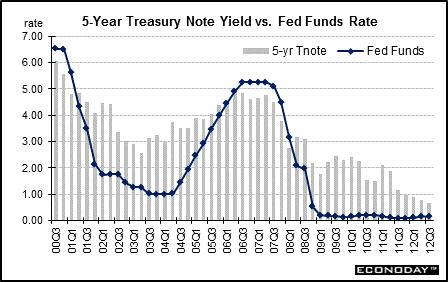
The spread between the 5-year note yield and the federal funds rate averaged 106 basis points between 2000 and 2011. The average spread stood at minus 22 basis points in 2006, but fell to minus 60 basis points in 2007 as more investors moved funds into the bond market on flight to quality over subprime issues and also due to expectations of further Fed easing in 2008. The spread bounded back into positive territory in 2008, averaging 87 basis points, reflecting the Fed’s sharp rate cuts. In 2009, the spear spread jumped sharply to 203 basis points due to the Fed cutting the fed funds target to near zero in December 2008. But it eased back to 175 basis points in 2010 on flight to safety in Treasuries and declined further to 142 basis points in 2011.

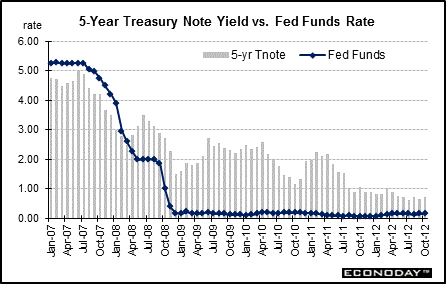
It is not unusual to see average yields on 5-year notes to run at least 100 basis points over the fed funds rate target – at least during periods of stability in monetary policy stance. More recently, the Fed cut the fed funds target rate sharply from 5.25 percent in mid-2007 to a range of zero to 0.25 percent on December 16, 2008. The 5-year note rate was below the fed funds target until late March 2008. Extremely easy Fed policy has turned the spread positive. In fact, during the first half of 2009, rates firmed on better-than-expected economic data and over fears of looming supply to fund the federal deficit. During early 2010, rates firmed as the recovery has gained traction. But rates fell notably in mid- and latter 2010 on flight to safety on concerns about European sovereign debt and on the Fed implementing a second round of quantitative easing. Inflation fears from higher oil prices, a lessening of concern about European sovereign debt, and better economic data bumped rates up in early 2011. But it mid-2011, those factors reversed. In early 2012, those issues have been “on” and “off,” depending on traders’ views of progress or not on sovereign debt in Europe. But a softening in global growth has led to slippage in rates in 2012. The 5-year note yield in October rise 4 basis points to 0.71 percent, putting the spread at 55 basis points, compared to 52 in the prior month.

Values shown reflect monthly averages.


About the Bond Market • Bond Market Charts • Treasury Market Charts • Treasury Auctions
|
 |

